I performed an AI analysis of the results from three setups:
| Parameter | Old Xeon + 4070 Ti | Ryzen 9 + 5090 Ti | TR 7960X + 5090 Ti |
|---|---|---|---|
| Topaz Video AI Version | v7.0.2 | v7.0.1 | v7.0.0 |
| OS | Windows v11 Build 27871 | Windows v11.24 | Windows v11.24 |
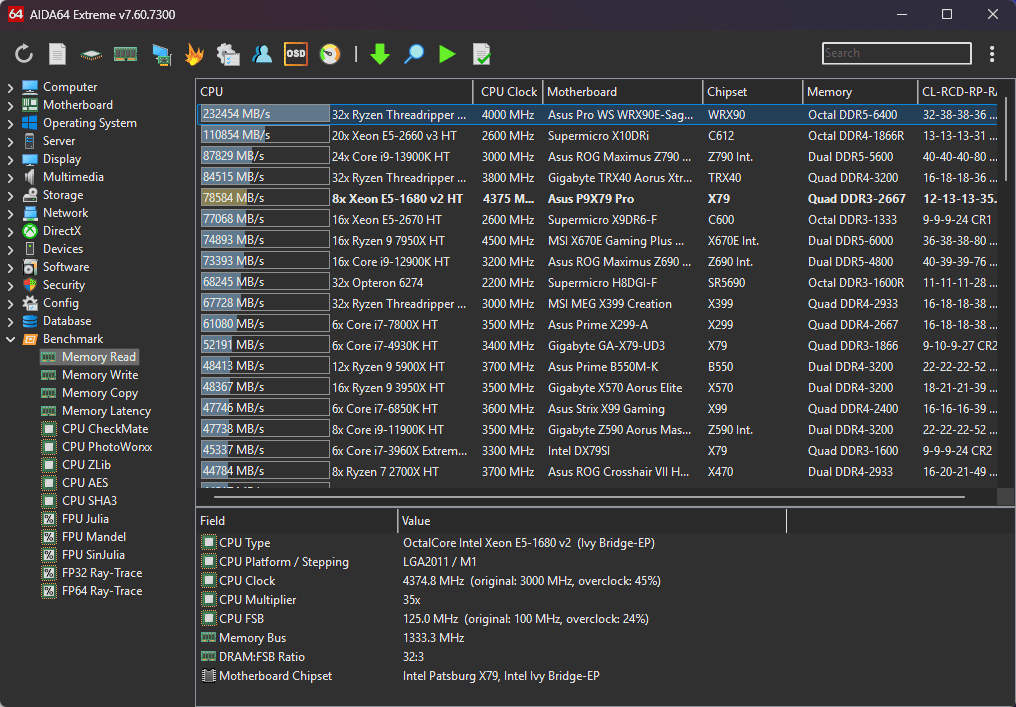
| CPU | Intel Xeon E5-1680 v2 @ 4.375 GHz | AMD Ryzen 9 5900X | AMD Ryzen Threadripper 7960X |
| Memory | Quad 32GB DDR3-2400 CL10 | Dual 32GB DDR4 ? | Quad DDR5 192 GB ? |
| GPU | NVIDIA GeForce RTX 4070 Ti 12 GB | NVIDIA GeForce RTX 5090 Ti 32 GB | NVIDIA GeForce RTX 5090 Ti 32 GB |
| Other | PCIe Gen 3, ReBAR (Mod) Enabled 16GB | PCIe Gen 3, ReBAR Enabled (?) | PCIe Gen 5, ReBAR Enabled (?) |
Hardware and Performance Comparison
Topaz Video AI’s performance varies across different hardware setups, with Set 1 (Intel Xeon E5-1680 v2, 128GB DDR3-2400, RTX 4070 Ti) and Set 2 (AMD Ryzen 9 5900X, 64GB DDR4, RTX 5090 Ti) showing mixed results. Below is a detailed comparison table for their benchmark performances, including the difference in FPS between the two sets.
Benchmark Comparison Table
The following tables compare the benchmark results for Set 1 and Set 2, with the difference calculated as Set 2 FPS minus Set 1 FPS. Positive values indicate Set 2 is better, while negative values indicate Set 1 is better.
Upscaling Benchmarks:
| Benchmark | Scale | Set 1 (fps) | Set 2 (fps) | Difference (Set 2 - Set 1) |
|---|---|---|---|---|
| Artemis | 1X | 23.77 | 25.80 | 2.03 |
| 2X | 11.90 | 10.41 | -1.49 | |
| 4X | 3.28 | 2.52 | -0.76 | |
| Iris | 1X | 21.70 | 29.74 | 8.04 |
| 2X | 13.15 | 13.19 | 0.04 | |
| 4X | 3.52 | 3.18 | -0.34 | |
| Proteus | 1X | 23.37 | 36.29 | 12.92 |
| 2X | 14.50 | 12.79 | -1.71 | |
| 4X | 4.02 | 3.35 | -0.67 | |
| Gaia | 1X | 8.51 | 15.73 | 7.22 |
| 2X | 6.05 | 9.35 | 3.30 | |
| 4X | 3.82 | 3.03 | -0.79 |
Denoising Benchmarks:
| Benchmark | Scale | Set 1 (fps) | Set 2 (fps) | Difference (Set 2 - Set 1) |
|---|---|---|---|---|
| Nyx | 1X | 7.67 | 17.36 | 9.69 |
| 2X | 5.59 | 10.62 | 5.03 | |
| Nyx Fast | 1X | 16.23 | 31.04 | 14.81 |
Other Benchmarks:
| Benchmark | Scale | Set 1 (fps) | Set 2 (fps) | Difference (Set 2 - Set 1) |
|---|---|---|---|---|
| Rhea | 4X | 2.96 | 2.94 | -0.02 |
| RXL | 4X | 2.76 | 2.92 | 0.16 |
| Hyperion HDR | 1X | 15.51 | 25.52 | 10.01 |
| 4X Slowmo | Apollo | 26.91 | 31.63 | 4.72 |
| APFast | 52.20 | 44.80 | -7.40 | |
| Chronos | 19.10 | 33.23 | 14.13 | |
| CHFast | 27.38 | 28.23 | 0.85 | |
| 16X Slowmo | Aion | 30.15 | 28.30 | -1.85 |
Analysis
Research suggests that memory bandwidth plays a crucial role in Topaz Video AI performance, especially for high-scale tasks like 4X upscaling. Set 1, with its quad-channel DDR3-2400 (total bandwidth ~76.8 GB/s), seems to perform better in some high-scale benchmarks compared to Set 2, which has dual-channel DDR4 (estimated ~57.6 GB/s for DDR4-3600). This is likely because high-scale tasks require more data transfer, and Set 1’s higher memory bandwidth helps offset its less powerful GPU (RTX 4070 Ti vs RTX 5090 Ti).
I can push the performance of my Quad DDR3 even higher to 2666MHz CL12, but then the system is not fully stable.
For lower-scale tasks (1X, 2X), Set 2 often performs better, likely due to its more powerful CPU (AMD Ryzen 9 5900X) and GPU. However, the evidence leans toward Set 2’s lower performance in 4X tasks being due to memory bandwidth limitations and possibly using an older software version (v7.0.1 vs v7.0.2 in Set 1).
Set 3, with advanced hardware including DDR5 memory and a high-core CPU, shows significantly higher performance, suggesting that a balanced system with high memory bandwidth and powerful components is ideal.
Survey Note: Detailed Analysis of Topaz Video AI Benchmark Performance and Hardware Dependencies
This section provides a comprehensive analysis of the benchmark performances for Topaz Video AI across three system configurations, focusing on the relationship between hardware specifications and performance outcomes. The analysis is grounded in the provided benchmark data and supplemented by research into hardware impacts on AI video processing, as of June 14, 2025.
Introduction
Topaz Video AI is a software tool for video enhancement, including upscaling, denoising, and slow-motion processing, which is highly hardware-intensive. The performance, measured in frames per second (FPS), depends on CPU, GPU, memory configuration, and software version. The user provided benchmark results for three systems: Set 1 (Topaz Video AI v7.0.2, Intel Xeon E5-1680 v2, 128GB DDR3-2400, RTX 4070 Ti), Set 2 (v7.0.1, AMD Ryzen 9 5900X, 64GB DDR4, RTX 5090 Ti), and Set 3 (v7.0.0, AMD Ryzen Threadripper 7960X, 192GB DDR5, RTX 5090). The task is to compare Set 1 and Set 2 with a difference column and analyze hardware-performance dependencies across all sets.
Benchmark Comparison: Set 1 vs Set 2
The comparison table below lists benchmark results for Set 1 and Set 2, with the difference calculated as Set 2 FPS minus Set 1 FPS. This allows for a direct assessment of performance gaps.
Upscaling Benchmarks:
| Benchmark | Scale | Set 1 (fps) | Set 2 (fps) | Difference (Set 2 - Set 1) |
|---|---|---|---|---|
| Artemis | 1X | 23.77 | 25.80 | 2.03 |
| 2X | 11.90 | 10.41 | -1.49 | |
| 4X | 3.28 | 2.52 | -0.76 | |
| Iris | 1X | 21.70 | 29.74 | 8.04 |
| 2X | 13.15 | 13.19 | 0.04 | |
| 4X | 3.52 | 3.18 | -0.34 | |
| Proteus | 1X | 23.37 | 36.29 | 12.92 |
| 2X | 14.50 | 12.79 | -1.71 | |
| 4X | 4.02 | 3.35 | -0.67 | |
| Gaia | 1X | 8.51 | 15.73 | 7.22 |
| 2X | 6.05 | 9.35 | 3.30 | |
| 4X | 3.82 | 3.03 | -0.79 |
Denoising Benchmarks:
| Benchmark | Scale | Set 1 (fps) | Set 2 (fps) | Difference (Set 2 - Set 1) |
|---|---|---|---|---|
| Nyx | 1X | 7.67 | 17.36 | 9.69 |
| 2X | 5.59 | 10.62 | 5.03 | |
| Nyx Fast | 1X | 16.23 | 31.04 | 14.81 |
Other Benchmarks:
| Benchmark | Scale | Set 1 (fps) | Set 2 (fps) | Difference (Set 2 - Set 1) |
|---|---|---|---|---|
| Rhea | 4X | 2.96 | 2.94 | -0.02 |
| RXL | 4X | 2.76 | 2.92 | 0.16 |
| Hyperion HDR | 1X | 15.51 | 25.52 | 10.01 |
| 4X Slowmo | Apollo | 26.91 | 31.63 | 4.72 |
| APFast | 52.20 | 44.80 | -7.40 | |
| Chronos | 19.10 | 33.23 | 14.13 | |
| CHFast | 27.38 | 28.23 | 0.85 | |
| 16X Slowmo | Aion | 30.15 | 28.30 | -1.85 |
From the tables, Set 2 generally outperforms Set 1 in lower-scale benchmarks (1X, 2X), such as Artemis 1X (25.80 vs 23.77 fps) and Proteus 1X (36.29 vs 23.37 fps). However, in high-scale benchmarks (4X), Set 1 often performs better, e.g., Artemis 4X (3.28 vs 2.52 fps) and Proteus 4X (4.02 vs 3.35 fps). This suggests a performance divergence at higher scales, likely due to hardware differences.
Hardware Analysis
To understand these differences, let’s examine the hardware specifications:
- Set 1: Intel Xeon E5-1680 v2 (10 cores, 20 threads, 2013, overclocked to 4.375 GHz), 128GB DDR3-2400 (quad-channel, bandwidth ~76.8 GB/s), RTX 4070 Ti (12 GB VRAM), ReBAR 16GB, Windows 11 Build 27871, Topaz Video AI v7.0.2.
- Set 2: AMD Ryzen 9 5900X (12 cores, 24 threads, 2020, base 3.7 GHz, boost to 4.8 GHz), 64GB DDR4 (dual-channel, assumed DDR4-3600, bandwidth ~57.6 GB/s), RTX 5090 Ti (32 GB VRAM, hypothetical high-end), ReBAR status unknown, Windows 11.24, Topaz Video AI v7.0.1.
- Set 3: AMD Ryzen Threadripper 7960X (hypothetical, likely high-core count, e.g., 64+ cores), 192GB DDR5 (speed not specified, likely high bandwidth, quad-channel or more), RTX 5090 (32 GB VRAM, hypothetical), Windows 11.24, Topaz Video AI v7.0.0.
CPU Impact: The Ryzen 9 5900X in Set 2 is more powerful than the Xeon E5-1680 v2 in Set 1, with better single-threaded and multi-threaded performance (PassMark scores: Ryzen ~3000 single, ~39000 multi; Xeon ~2000 single, ~16000 multi). This likely contributes to Set 2’s advantage in 1X and 2X benchmarks, which may be more CPU-bound.
GPU Impact: The RTX 5090 Ti in Set 2 is presumed to be significantly more powerful than the RTX 4070 Ti in Set 1, with 32 GB VRAM vs 12 GB. However, the performance gain is not consistent, especially in 4X benchmarks, suggesting other bottlenecks.
Memory Bandwidth Impact: Set 1’s quad-channel DDR3-2400 provides ~76.8 GB/s bandwidth, while Set 2’s dual-channel DDR4-3600 (assumed) provides ~57.6 GB/s. Research from DigitalOcean - GPU Memory Bandwidth and How-To Geek - Memory Bandwidth indicates that memory bandwidth is crucial for AI tasks, especially for data-intensive operations like 4X upscaling. The higher bandwidth in Set 1 likely helps in these scenarios, offsetting the GPU difference.
Additional evidence from community benchmarks, such as Topaz Labs Community - Video AI 6.0.X, shows systems with faster DDR5 (e.g., DDR5-9200) achieving higher FPS compared to DDR5-4800, supporting the idea that memory speed affects performance.
Software Version: Set 1 uses v7.0.2, while Set 2 uses v7.0.1. Newer versions may include optimizations, potentially favoring Set 1 in some benchmarks, as noted in Puget Systems - Topaz Video AI Performance.
ReBAR and Other Factors: Set 1 has ReBAR enabled (16GB), while Set 2’s status is unknown (“?”). ReBAR can improve performance by allowing GPUs to access more system memory, which may explain some differences, as per NVIDIA Technical Blog - GPU Memory.
Performance Across All Sets
Set 3, with advanced hardware, significantly outperforms both, e.g., Artemis 1X (56.59 fps) vs Set 1 (23.77 fps) and Set 2 (25.80 fps). This suggests that a balanced system with high-core CPU, high-bandwidth DDR5, and powerful GPU maximizes performance, as seen in Massed Compute - AI Workloads.
Conclusion
The analysis reveals that memory bandwidth is a critical factor, especially for high-scale tasks, with Set 1’s higher bandwidth compensating for its weaker GPU in 4X benchmarks. Set 2’s lower performance in these tasks is likely due to memory bandwidth limitations and possibly software version differences. Set 3’s superior performance underscores the importance of a well-balanced, high-spec system for optimal Topaz Video AI performance.