Gigapixel v5.5.2

Hi AiDon,
I’m the OP on this. I’ve been holding off on upgrading to the latest version of Gigapixel AI from 5.4.5 because, as zamfir1235 pointed out, many people have reported a loss of sharpeness over earlier versions.

I see that you are a beta tester. Are you suggesting that no such loss of sharpness exists?

Thanks,
Michael

Its not just my opinion. Its many people’s opinion.

Like i said before, people deliberately choose to ignore the truth. I can’t help in that case.

Topaz is supposed to address this issue, but they really don’t care. So there is no point me and you fighting over it.

Lets end this argument here. you are happy with the newer version and i m happy with older version. End of story.

I remember that I had said that you can fix the sharpness with Sharpen or whatever sharpens.

What comes out at the end always depends on the file, the larger the better.

At the end of the day in the discussion we came to the conclusion that it is subtle how you evaluate the output.


5.4.5 Standard


5.4.5 Compressed


5.5.2 Low Res + Sharpen


5.5.2 Lowres

I must say that the difference is so small that I prefer the speed of 5.5.2.

But yes, 5.4.5 looks better in the details, i’m also not happy with sharpen, there are too much colored artifacts that has to be fixed afterwards.

You can influence the output by sharpening a bit more beforehand with a sharpener that doesn’t form halos like photoshop’s smart sharpen.

Gigapixel then gets more details to work with.


I also don’t like how the A.I. reacts, many areas are calculated differently in terms of detail, the difference is small and not seen by most.

1 Like

Thanks. I certainly like best your 5.4.5 compressed. Besides uneven sharpness, too many artifacts/halos in other.

For my particular hardware, i7 & GTX1050 (Studio 462.59), I am not seeing the issues others are here. This may also be related to the genre I am processing which is mainly landscape.

I would always recommend try the product first and then decide based on your requirements.

How does one “try out” an upgrade? Can it be removed and the program reverted back to the previous version?

Been quite a while since there have been any updates to Gigapixel, has development stopped?

Do you mean try out a product that’s out of your annual subscription or in it?

If you have no active subscription you don’t have to start the type of trial that used to be available anymore. You can try any Topaz product you don’t subscribe to by downloading it from their Downloads page. But you will get a large watermark tattooed on the images you run.

If you have an active subscription for a product(s) & upgrade to the latest version you can always roll back to one of the previous 1-3 releases (it varies…) posted in the Product Releases discussion thread. I’d recommend you uninstall a later release before rolling back to an earlier release (it’s less needed to do that when upgrading to a latest release).

I like your photo!

The 5.5.2 image samples look noticeably less sharp than the 5.4.5 examples.

But, I guess it would come down to personal preference & intended use. Plus, your spd performance value std.

5.5.x has more soft image and in my opinion it’s better. But some times, GP has very low quality image, especially in eyes.

1 Like

Good to know! Thx for your thoughts on that.

I think there’s something wrong with the version for MacOS. Maybe a memory leak?

I had this folder with ~500 files, all under 700px in width and 1000px in height. My laptop crashed twice while upscaling the files. I noticed that the Gigapixel was using 25GB of memory at one point and it kept increasing after a file was done upscaling.

( Screenshot: https://i.imgur.com/TVP8xsP.png)

The only way to clear the memory was to actually close the app as removing the files from the app did nothing.

Computer: Macbook Pro 16", 2019, Intel, 16 RAM, MacOS Big Sur.
Settings: Standard, auto settings, reduce color bleeding ON, face refinement ON. Model downloading ON, AI Processor AMD Radeon Pro 5500M, Allowed memory consumption Low.

For MacOS, when dragging image files to the Gigapixel app icon in the Dock, it doesn’t open the “Save Image As” window. It just starts saving the image, but it crashes at the end, and nothing is got saved. #photo-beta-testing:gigapixel-beta #topaz-products:product-bugs

Open via the application, dragging from finder to the application opens in plug-in mode so it will only update the currently used file. That means you that you cannot open RAW images and “save as”.

1 Like

@taylor.bishop (Added this as finding more problems and no reason to assume you randomly trawl through older forum threads after a version’s been released.)

Been a while since I tested this and things seem to have gone backwards for my setup in V5.5.2.
I’m one of the few still using this on a Windows 7 PC with an NVidia GTX 980 and the GPU seems to be being ignored.

A 50% Preview of an image that is 684 x 828 pixels takes 87 seconds. I cropped that out of an 8000x4000 360 Panoramic image because I wondered if it was processing the whole thing - or a large section of it - or using more RAM to hold the larger image. It wasn’t.

Setting were Default GPU and Memory Low and ‘Standard’ @ x2 Magnification.
Results were 100% CPU usage and ~18% GPU usage according to MSI Afterburner.

I use those settings because in the past they produced the most usable results. More Memory usage = more artifacts. CPU actually produced the Best results, but was so much slower than GPU, the relatively small difference wasn’t worth the tradeoff for some images. Then again, some do have to be reprocessed with CPU, so not sure of actual total time saved.

Switching to CPU and Memory Low (or Med) gives exactly the same results, so GPU evidently isn’t being used, although it is selectable.

Going back to an earlier version of 5.2.0 and Preview takes only 11 seconds, CPU usage is 25% only on half the threads (6 threads of 12 on a 6 core CPU) and GPU usage is 100%.

Switching to CPU and Low, and GPU usage is ~2% - which is effectively Windows’ background usage, so basically zero. CPU usage is ~43% on 9 of 12 threads and only take 47 seconds.

I always test with Suppress Noise and Reduce Blur sliders set to 100%, because having to reduce a slider to remove ‘artifacts’ isn’t what I want it to do, I want more or less of what the Slider does only. Results are always better than what Auto guesses too, IMO. YMMV.

5.2.0 took exactly 1 minute to export the Image and told me so.
5.5.2 took 2 min 3 secs to export the image and didn’t tell me. I had to time it. I evidently missed the discussion where some prefer not to see the export time? IMO, it’s useful when you’re batch processing because you can plan ahead and pack/prune the batch list accordingly.

This time the Export GPU usage (although GPU was selected) was ~2% (or zero) again, and CPU pegged at 100% on all 12 cores. It’s a mystery what it was using ~18% GPU on while generating the Preview, unless it was constantly updating the screen the whole time it was calculating it?

Overlaying the two images and toggling between them and pixel-peeping, the 5.5.2 version is slightly sharper, but also noisier and with very slightly more of the usual red/green ‘additional’ pixels at boundaries, so - for me (and other Windows 7 users?) anyway - no obvious improvements.

Finally, the Preview Windows isn’t the correct size. E.g at 100% it’s larger by some amount, which means diagonal lines have ‘jaggies’ in them where lines are doubled up when it is stretched. Also there are more red/green pixel artifacts in the Preview than there are in the final image, which makes judging what settings to use a little trickier.

See attached of a Preview and the final image overlaid on a screengrab, and a closeup showing a detail more clearly.

Sorry, can’t be more positive. :slight_smile:

1 Like

Interestingly, since I’ve exported those test images, some internal settings seem to have been ‘updated’.

Now GPU usage is always zero for Previews whether GPU is selected or not, rather than the mystery ~18% during Previews as before and now they only take 27 seconds. Also CPU is always 100% whether GPU is selected or not.

But, selecting CPU or GPU does change the AI model used and the results on the Preview Windows look different.

Exporting is different again: GPU export actually uses ~17% of the GPU and 100% CPU and took 27 seconds (for a different, smaller 391x334 image than before).

CPU export used ~2% GPU and 100% CPU and took slightly longer at 32 seconds.

But both images were pixel identical and also had some new visual artifacts:vertical lines and corruption at the bottom. Maybe the odd width upset it (391 pixels)?

Will play some more with different images.

CPU%20and%20GPU%20artifacts

Please go to Help menu, select Graphics info and press Copy then paste the info here.

Application & Version: Topaz Gigapixel AI Version 5.5.2
Operating System: Windows 7 Version 6.1 (Build 7601: SP 1)
Graphics Hardware: GeForce GTX 980/PCIe/SSE2
OpenGL Driver: 3.3.0 NVIDIA 456.71
CPU RAM: 12279 MB
Video RAM: 4096 MB
Preview Limit: 6188 Pixels

I’ve also did a quick test of GPU/CPU + Hi/Med/Low and found that the settings in Preferences aren’t always being applied on export unless you do a Preview in between.

E.g. I export, go change GPU/CPU or RAM usage settings, re-export and the resulting images are identical. But if do a Preview and export again, the exported image will have changed. I believe that’s how I got the pixel identical images before with the vertical lines/artifacts when I swapped between CPU and GPU. Doing it again with Previews before each export and they are different.

But even doing a Preview isn’t 100% the solution, as I did still get one example of identical results with CPU+Low and CPU+High on one test. They were different on the second attempt when I started to go through them all again.

1 Like

Check your GPU driver on the NVIDIA website as it seems to be out of date, if it is update to the latest Studio driver and see if that helps.

Application & Version: Topaz Gigapixel AI Version 5.5.2
Operating System: Windows 7 Version 6.1 (Build 7601: SP 1)
Graphics Hardware: NVIDIA GeForce GTX 980/PCIe/SSE2
OpenGL Driver: 3.3.0 NVIDIA 471.68
CPU RAM: 12279 MB
Video RAM: 4096 MB
Preview Limit: 6361 Pixels

I’d normally not expect this make a difference, but after a Drivers Update and Reboot, it has made some very slight changes to the outputs; but it’s not clear if it’s fixed something, or broken it more than before.

Having Exported some files previously, it had stopped using the GPU (~18%) during Previews whether or not it was selected. Swapped between GPU and CPU several times and it never uses it, but now it also does not refresh the Preview when you make changes and there is a disconnect between any Preference changes and the Preview window.

Moving the Window position forces the Update button to appear (I have Auto-Update Off) but aborting half way through and putting it back where it was before (I use corners of the small image, of which 95% fits in the window anyway @50%, so easy to put it exactly where it was before) and it will show the previous Preview image for that position, even if it’s GPU now and was CPU before. It was even able to show a Preview of a different corner done before that one; so possibly it’s able to cache several if they’re small? If it is, caching might be the reason for several ‘lags’ when things are changed.

I screengrabbed one as GPU/Low, exited and reloaded the program, swapped GPU to CPU, Previewed the same corner, screengrabbed and pixel-peeped and they’re identical. Which now…the Exports also are, when they were obviously different before the Driver update. So, is it more broken or less?

The Preview of the 684x828 image using GPU/Low at 50%, Standard, x2, Noise and Sharpen Sliders at 100% took 106 seconds with no GPU usage, rather than the previous 87 seconds where GPU usage was ~18%. CPU was at 100% throughout.

But, switching to CPU/Low (GPU usage was ~2%/Zero) and the Preview took only 94 seconds. So…CPU only was faster than CPU+GPU?

Exporting behaviour is variably consistent. Exporting as CPU/Low right after that - so hoping that Previewing would get it to recognise that as the ‘current’ state - and GPU was again a steady ~17%.

I’d accidentally pressed Stop on the stopwatch app, so I aborted at about 95% complete. Then I exported it again and GPU usage then dropped to ~2% (or zero) and it took 2 minutes and 4 seconds.

I saved this image for later comparisons.

Switched to GPU/Low, did a Preview (107 seconds and no GPU usage) then Export and GPU usage fluctuated between 17% and 8%, so a bit less steady than before, and it took 2 min 5 seconds. Exported it again, identical results and times, so no real difference to the previous CPU with GPU ~17%.

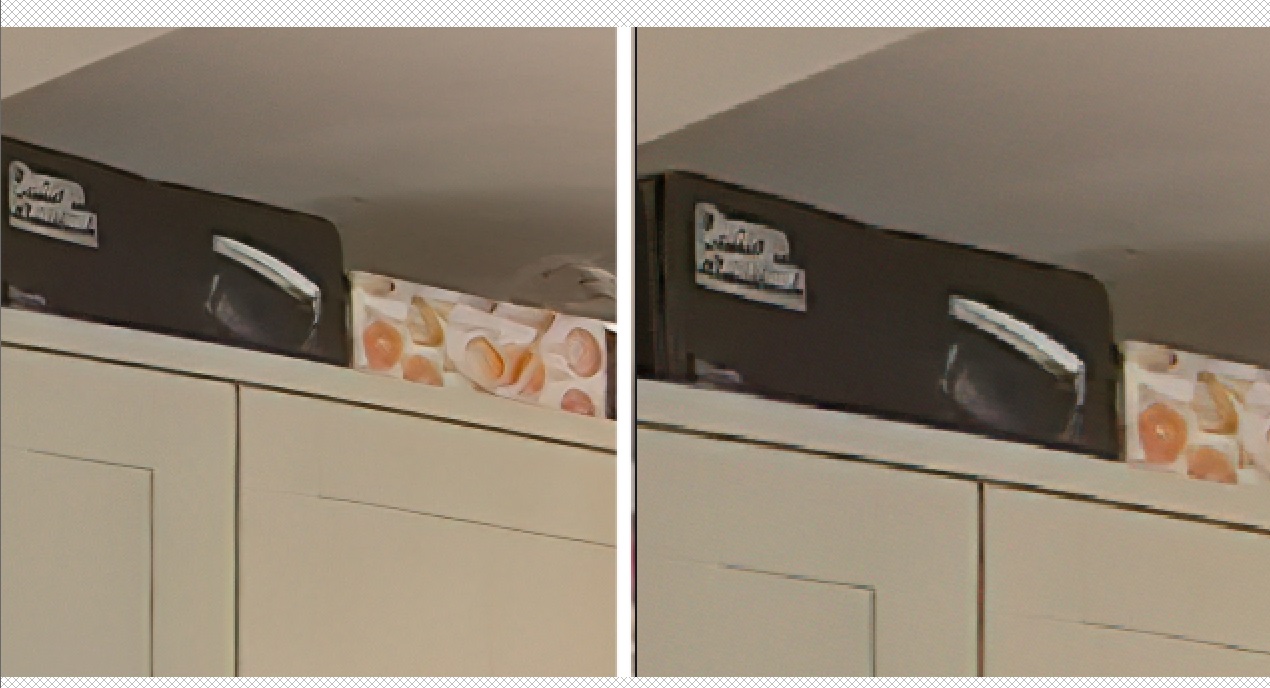
I then compared the images and with overlaid GPU/Low and CPU/Low images and pixel-peeping, they were completely identical; when the tests I did yesterday with the previous GPU drivers showed GPU/Low and CPU/Low were different with CPU noticeably sharper.

So after the driver update, it’s not clear if it’s now using GPU for both GPU and CPU, or for neither.

Updated drivers’ CPU/Low is about the same higher sharpness - but considerably noisier - than the previous drivers’ CPU/Low or GPU/Low, so I’m to reinstall the older drivers for now, as we have no way of knowing which drivers this was developed/tuned with and those older drivers worked well with previous versions of GAI.

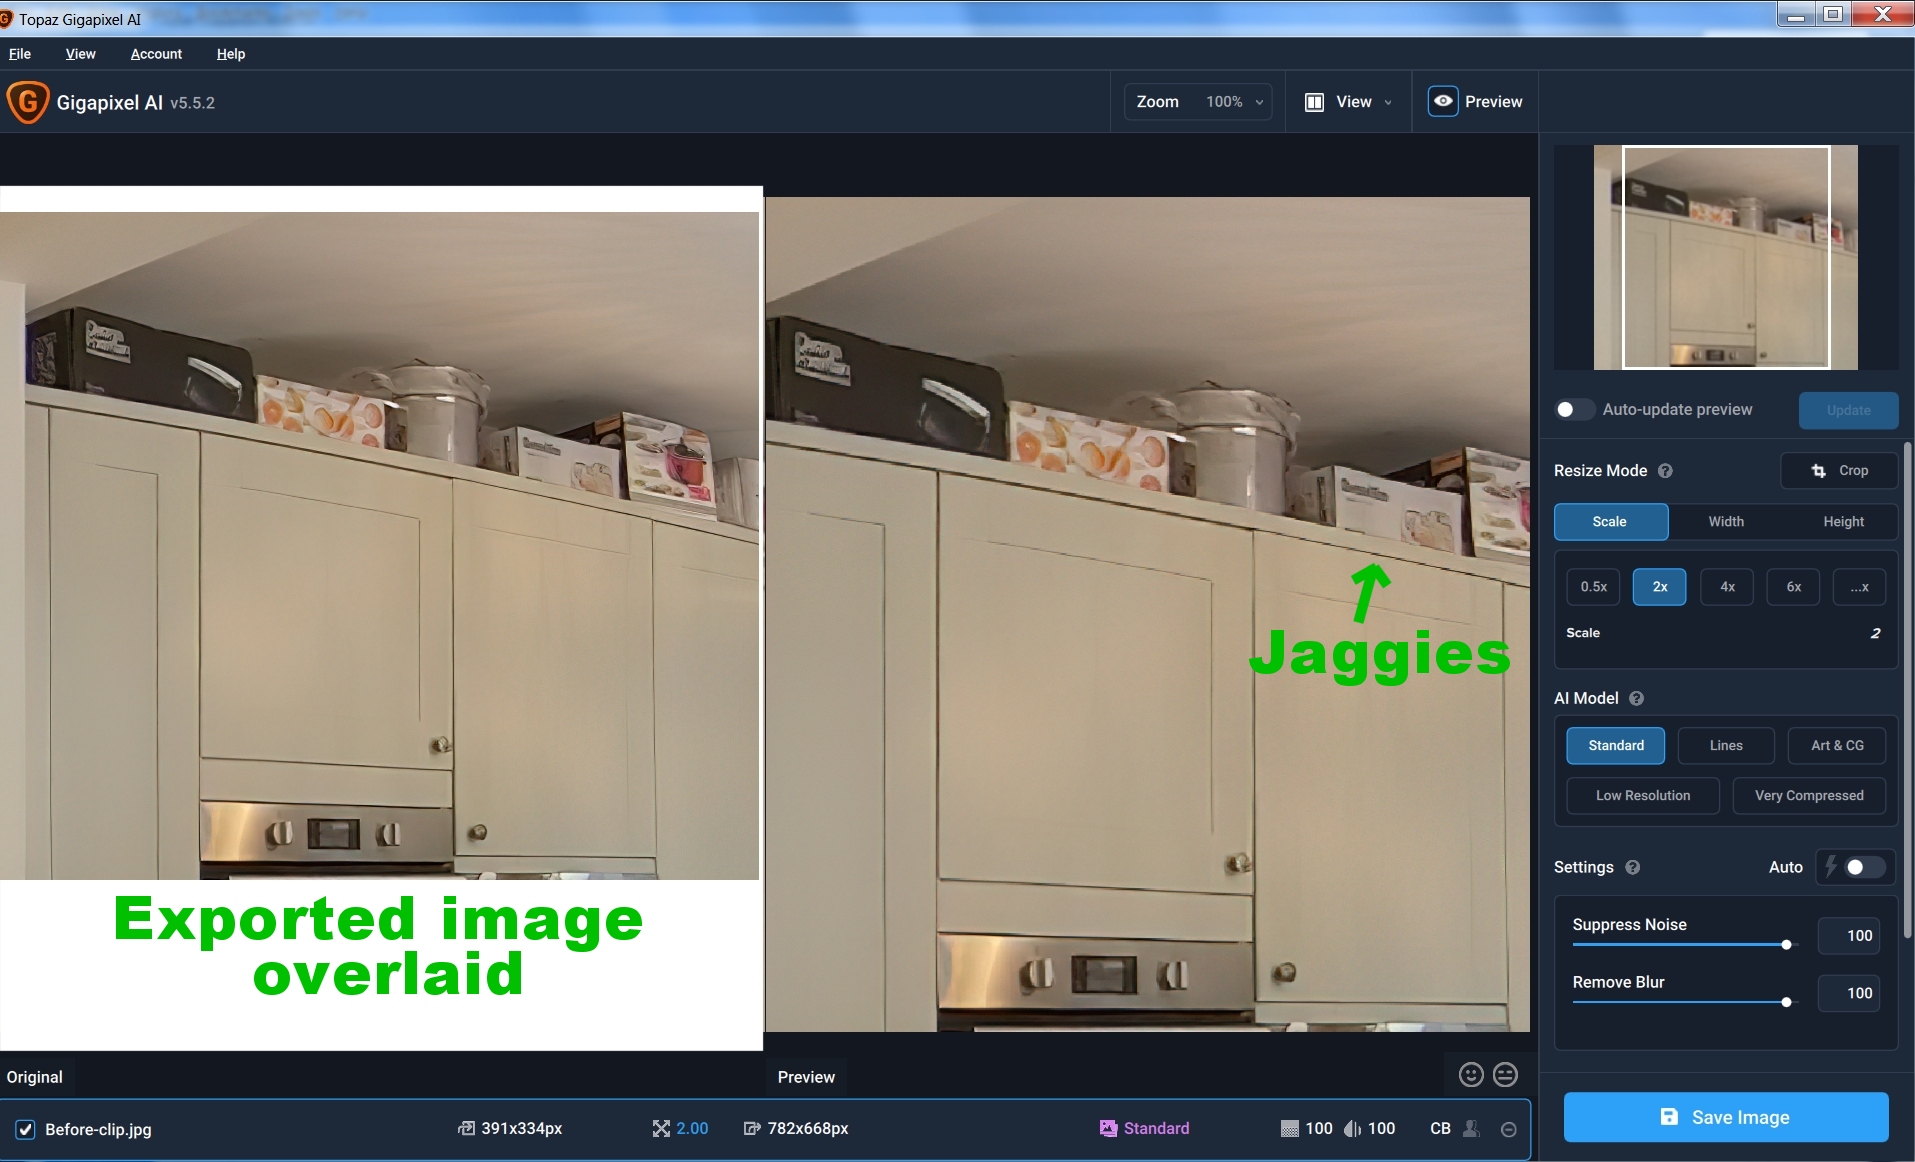
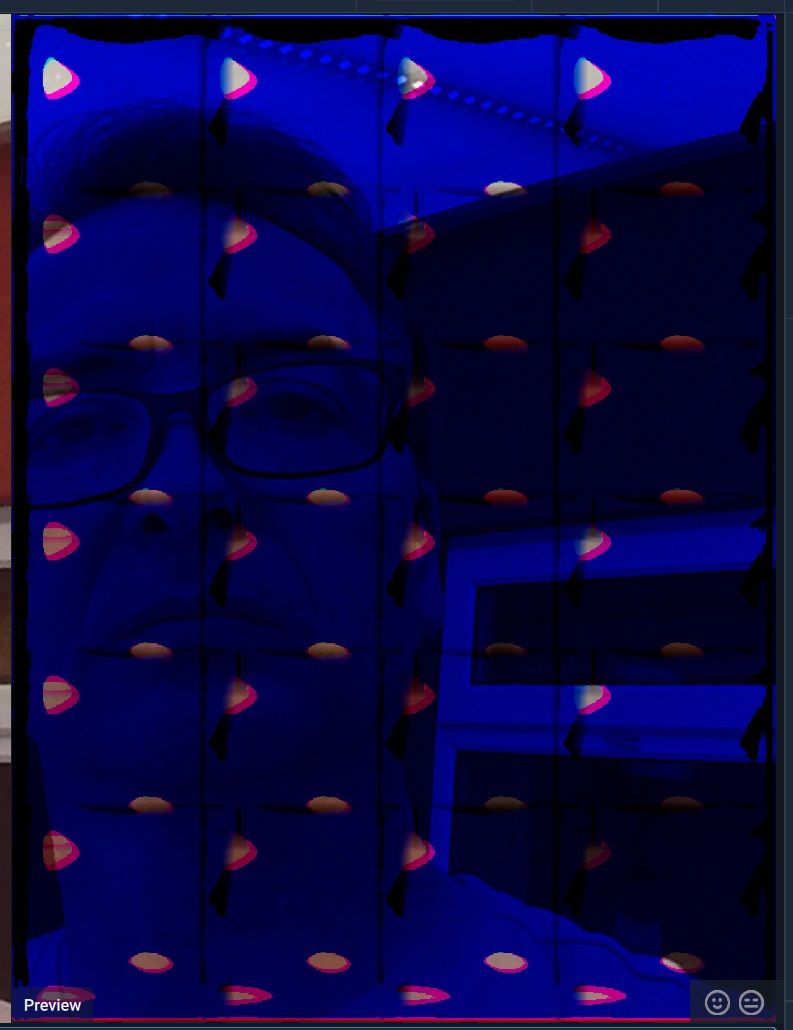
The ‘Jaggies’ are still there in the Preview windows and on one of the newer drivers’ GPU Previews it did this…