Luma Tab — Redesigned leading to Chromaster 2.0.1
The Luma tab has been significantly redesigned. Here’s what’s new.
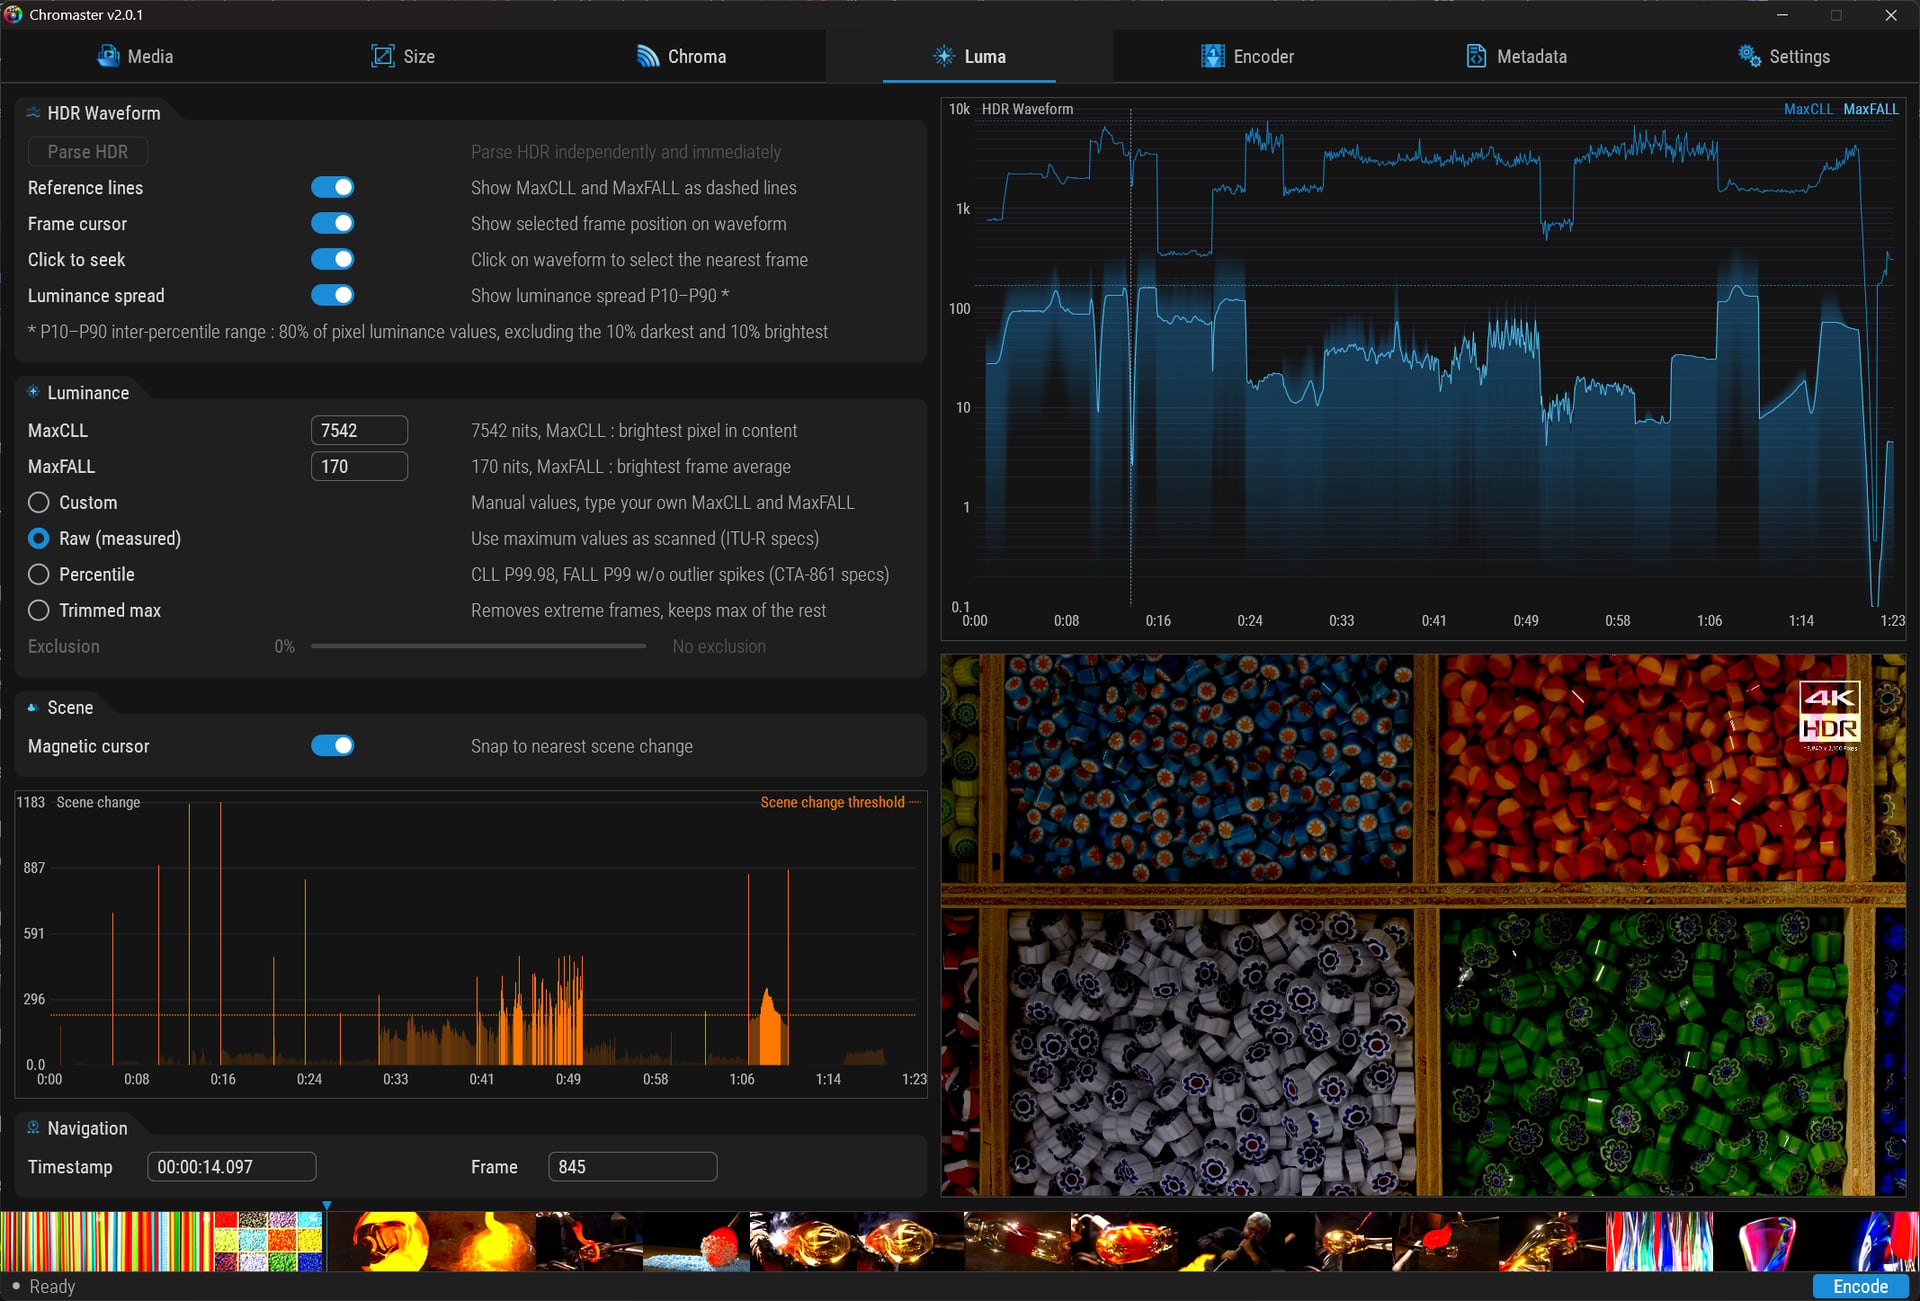
HDR Waveform — Now Fully Interactive
-
Click to Move: Click anywhere on the waveform to jump to the corresponding image. Click on the band: the waveform cursor follows you. The waveform and band are now perfectly synchronized: two entry points, same timeline.
-
Image Cursor: Displays the position of the selected image directly on the waveform graph.
-
Reference Lines: Toggle the display of MaxCLL and MaxFALL as dotted lines on the waveform.
-
P10–P90 Luminance Distribution: View the interpercentile range of 80% of pixel luminance, excluding the darkest and brightest 10%. Instantly see your luminance distribution, not just the extreme values.
HDR Attenuation — Four Modes for MaxCLL/MaxFALL
Instead of a single button, Chromaster now offers four strategies for calculating your HDR metadata:
-
Custom — Manual values: Enter your own MaxCLL and MaxFALL values.
-
Raw (Measured) — Uses the maximum values from the scan, according to ITU-R specifications.
-
Percentile — CLL P99, 98, FALL P99 without outliers, according to CTA-861 specifications.
-
Trunculated Maximum — removes extreme images and retains the maximum of the others.
Custom leads to an exclusion slider to control the degree to which outliers are removed (0% = no exclusions).
This is important because raw MaxCLL values are often inflated by a few extraneous images. The Percentile and Truncated Maximum modes allow you to generate compliant HDR10 metadata that accurately reflects your content, not noise.
This provides you with better guidance for your choices, with the added bonus of the option to follow CTA-861, more specifically used by studios, or ITU-R for rigorous mathematical accuracy.