Starlight 2.6 performing worse than 2.5

since the new update, the new starlight 2.6 is taking more longer time than the 2.5. Usually, the 2.5 will take 6 to 12 hours depends on video resolution and duration. but with the 2.6 it is taking triple the time. a 6 or 7 hours video is now taking a day and half maybe even more now to procced.

My hardware is : 4080 non super. 9800x3d, 48gb ram. win 11 pro. all of them are the lastest drivers.

Hours? You meant 6 or 7 minutes?

You must have written more data. What hardware and OS you have?

On my Win11, RTX5060Ti SLP2.6 works a little shorten.

I’m seeing substantially worse performance in SLP since upgrading to 2.6.

At the beginning of my conversion (SLP 2.6 upscale 480P to minimum resolution, sharpness 2), my computer progresses roughly 1% every 9 minutes or so. This progression is fairly linear up until it gets to about 59%, then the progress slows to 1% every 110 minutes - a ~10x reduction in speed. I have noticed this similar pattern (decent performance for the first half, terrible perfmance for the last half) on every video I’ve attempted since upgrading.

AMD Ryzen 7 5800x3d, 32GB RAM, NVidia RTX 5070ti

Sample log output showing slow down of progress:

2026-08-15 12-18-58.785 Thread: 12724 Info FF Process Output: 3 {“timestamp”: “2026-08-15 12:18:58,785”, “level”: “INFO”, “message”: {“status”: “RUNNING”, “frame”: 2184, “progress”: 10, “message”: “”}}
2026-08-15 12-27-00.738 Thread: 12724 Info FF Process Output: 3 {“timestamp”: “2026-08-15 12:27:00,737”, “level”: “INFO”, “message”: {“status”: “RUNNING”, “frame”: 2584, “progress”: 11, “message”: “”}}
2026-08-15 12-36-14.470 Thread: 12724 Info FF Process Output: 3 {“timestamp”: “2026-08-15 12:36:14,470”, “level”: “INFO”, “message”: {“status”: “RUNNING”, “frame”: 3021, “progress”: 12, “message”: “”}}
2026-08-15 12-45-04.929 Thread: 12724 Info FF Process Output: 3 {“timestamp”: “2026-08-15 12:45:04,929”, “level”: “INFO”, “message”: {“status”: “RUNNING”, “frame”: 3484, “progress”: 13, “message”: “”}}
2026-08-15 12-53-06.804 Thread: 12724 Info FF Process Output: 3 {“timestamp”: “2026-08-15 12:53:06,804”, “level”: “INFO”, “message”: {“status”: “RUNNING”, “frame”: 3884, “progress”: 14, “message”: “”}}
.
.
.
2026-08-15 19-20-53.149 Thread: 12724 Info FF Process Output: 3 {“timestamp”: “2026-08-15 19:20:53,148”, “level”: “INFO”, “message”: {“status”: “RUNNING”, “frame”: 23184, “progress”: 59, “message”: “”}}
2026-08-15 20-59-48.333 Thread: 12724 Info FF Process Output: 3 {“timestamp”: “2026-08-15 20:59:48,333”, “level”: “INFO”, “message”: {“status”: “RUNNING”, “frame”: 23584, “progress”: 60, “message”: “”}}
2026-08-16 00-45-53.261 Thread: 12724 Info FF Process Output: 3 {“timestamp”: “2026-08-16 00:45:53,261”, “level”: “INFO”, “message”: {“status”: “RUNNING”, “frame”: 24000, “progress”: 61, “message”: “”}}
2026-08-16 03-47-59.358 Thread: 12724 Info FF Process Output: 3 {“timestamp”: “2026-08-16 03:47:59,358”, “level”: “INFO”, “message”: {“status”: “RUNNING”, “frame”: 24412, “progress”: 62, “message”: “”}}
2026-08-16 06-30-51.670 Thread: 12724 Info FF Process Output: 3 {“timestamp”: “2026-08-16 06:30:51,670”, “level”: “INFO”, “message”: {“status”: “RUNNING”, “frame”: 24884, “progress”: 63, “message”: “”}}
Hi thanks for the replay but no actually all on hours the only clip that went for like 7 or 8 min was an ai video created with Seedance only to test this model. it was only 15s video.

This could of course be a Topaz bug, but check one more thing after that 59%. Is your equipment overheating and clocks CPU/GPU slowing down?

Hello and thanks for the clarifying. i have already updated my message with my pc specs. but yeah it is still work great for reha/ protues models. but starlight not really. All of them were taking 6 to 12 hours give or take. also I notice that 720p upscaled faster because will i just enhance them with same resolution unlike the 480p which enhance and upscaled to 720p. that is why the 480p videos taking longer time to finish.

Deleted.

encountered the same issue. Previously, a 1080p video lasting about 10 seconds would take only 10 minutes to process, but with version 1.7.0, it took an hour and still didn’t finish processing. The same problem also occurred with version 1.6.1

The support team is looking into reports of slower performance from some users within their workflows.

Can you share the logs for review? help@topazlabs.com

To gather logs, please select Help > Logging > Get Logs for Support and attach the zip file to your reply.

Here is a video to help with the steps of how to collect the logs.

I have captured the log file where the issue occurred

2026-08-18-08-39-12-Main.tzlog (209.8 KB)

2026-08-18-09-03-59-Main.tzlog (132.2 KB)

I’d like to report a performance issue after upgrading to v1.7.0.

Setup: RTX 5070 Ti (16GB) / Win11 25H2 / same video (214 frames, 1600×900, 25fps).

  • v1.6.0 + slp‑2.5 → export completes in ~7 min (exit code 0).

  • v1.7.0 + slp‑2.6 (softness:3) → extremely slow, then crashes with exit code 1.

From the logs, the chunk size processed in v1.7.0 is 121 frames, while v1.6.0 used only 33 frames for the same content. This seems to overload VRAM and cause the neuroserver to fail.
Could you review the chunk‑sizing logic and the memory footprint of the new model? It would be great if we could control chunk size manually or if slp‑2.6 could be tuned for better compatibility.

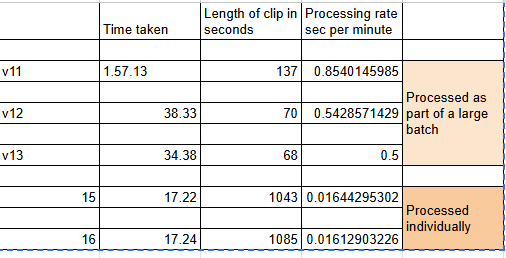
With version 17 I have noticed that if I have a lot of files in the processing queue with starlight precise the speed increases dramatically. For example with 10 files in the queue - which are all small file of a minute or 2 - and just doing a basic resize - 720x540 to 1280x720 - it willl take about an hour to do a minute of footage.

If I put 30 files in the list the same file will take hugely longer - a 10 second file can take 3-4 hours.

I do not get this with other models - Iris for example.

More files loaded into the app can hold more memory resources back which are then not available for the main processing task. Can you send the logs from the app where you have these running for review?

logsForSupport.zip (1.8 MB) Logs attached. This is using the beta version as I have been swapping between this and the release version to see if there is any difference.

logsForSupport.zip (1.1 MB) This is the logs from the release version where I first noticed the problem. Then I went back to the beta to see if it was different but it was the same.

And this is an example of the time being taken:

I’m seeing a reproducible 3–4x slowdown on Starlight Precise 2.6 that builds up over a session and is fixed by restarting the app.

System

  • Topaz Video 1.7.0
  • Windows 11
  • RTX 5090 (32GB VRAM), driver 596.49 (32.0.15.9649, 05/05/2026)
  • Ryzen 9 9950X3D, 96GB DDR5
  • Samsung 990 PRO 2TB + 9100 PRO 1TB, plenty of free space

Job settings (identical across all runs)

  • Model: Starlight Precise 2.6, Sharpness 3
  • Source: 768x1152, 8 seconds, progressive MP4
  • Output: 1280x1920
  • No other filters, no stabilization, no frame interpolation

What happens

Right after launching the app, an 8-second clip renders in 10–15 minutes. After processing several clips in the same session, the exact same clip on the exact same settings takes 30–60 minutes. Nothing about the job changes between runs.

During the slow runs, Task Manager shows:

  • Dedicated GPU memory: 28.3 / 31.5 GB
  • Shared GPU memory: 22.7 GB
  • GPU utilization: 100%
  • GPU temperature: 68°C (so this is not thermal throttling)

The process holding the memory is NeuroServer. On fast runs, shared GPU memory stays at or near zero - the job fits entirely in VRAM. On slow runs it spills into system RAM over PCIe, which is what appears to be causing the slowdown.

Workaround

Fully closing Topaz Video (and killing the NeuroServer process if it survives the app closing) restores the original speed immediately. It then degrades again after a few clips.

Expected behaviour

NeuroServer should release GPU memory after each job completes, so render times stay consistent across a session.

Question

Is this a known issue with NeuroServer memory not being released between jobs? Is there a setting that forces it to unload after each export, or do I need to restart the app every few clips?

Happy to provide logs or run any test builds.

I have this same problem. I am also using an RTX 5090. I have also had similar issues with version 2.5 where the same thing happened if the source clip I was rendering shorter clips from was 30 minutes or longer in duration. The longest duration output was one minute approximately.

Dear Topaz Team,

I’m writing to report a significant performance issue when upgrading from v1.6.0 to v1.7.0.

Environment:

GPU: RTX 5070 Ti (16 GB)

Driver: 32.0.16.1088

OS: Windows 11 25H2

Observations:

v1.6.0 with model slp‑2.5 completes a 214‑frame (1600×900) export in ~7 minutes without errors.

v1.7.0 with model slp‑2.6 (and “softness: 3”) runs extremely slowly and eventually crashes with exit code 1. The processing never finishes.

After comparing the logs, I noticed that v1.7.0 processes much larger frame chunks (121 frames) than v1.6.0 (33 frames) for the same video. This likely increases VRAM pressure and causes the neuroserver to fail. In addition, slp‑2.6 itself seems to be more resource‑hungry than slp‑2.5.

I’ve attached both log files for your reference. Could you please look into the chunk‑size policy and the memory footprint of the new model? It would be very helpful if we could manually control the chunk size or if the model could be optimised for the same hardware.

Thank you for your excellent work.

Best regards

2026-08-18-09-39-43-Main.tzlog (198.2 KB)

2026-08-18-09-03-59-Main.tzlog (132.2 KB)